
Hockey goalie analytics
Saves per goal.
That's it.
Save Ratio tells you how many saves a goalie makes for every goal they allow. It provides a more intuitive way to compare goalies than save percentage, and reflects how hockey fans actually think about the game.


 Scan to install on your phone
Free · No account required · 8 leagues
In both of these examples, Goalie 1 is making 50% more saves per goal allowed than Goalie 2:
What's more clear? Save ratio lets you compare goalie effectiveness without complicated math.
What it does
Built for
hockey fans
Live data from every league we cover, refreshed daily. No sign-in, no setup.
Rankings
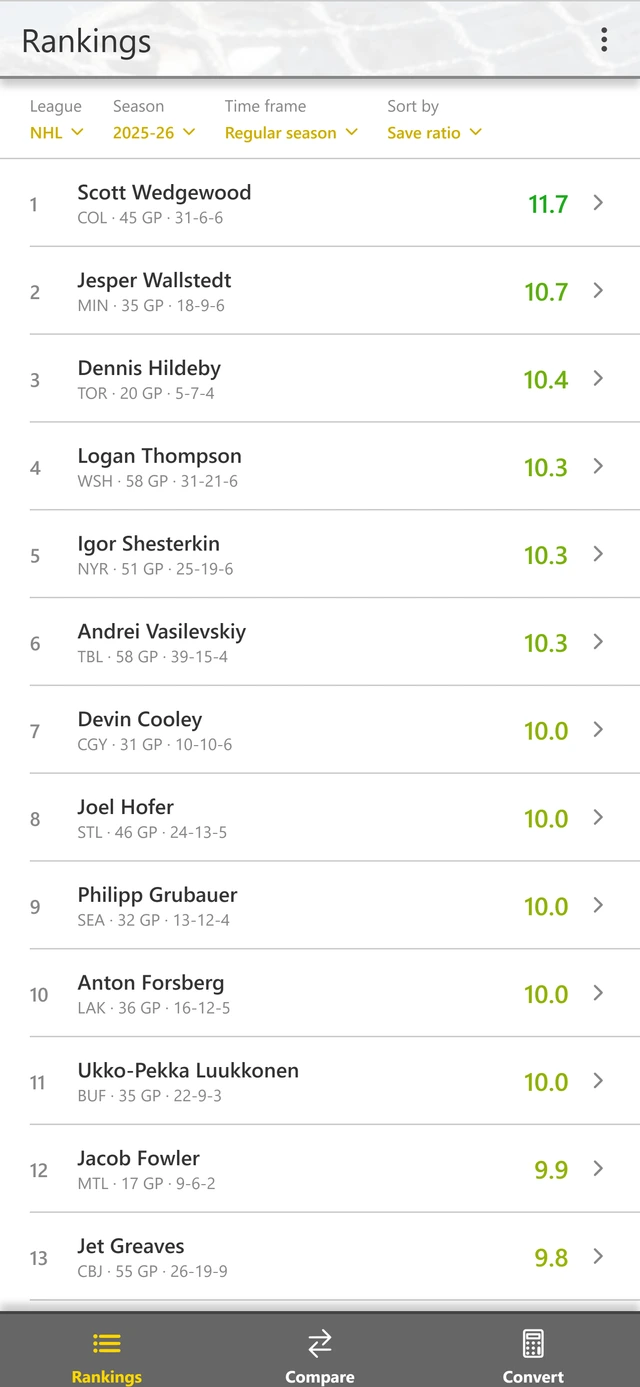
Select a time frame and rank every goalie by save ratio. It's the same data as save percentage, but the save ratio stat is more relatable and interesting.
Situational splits
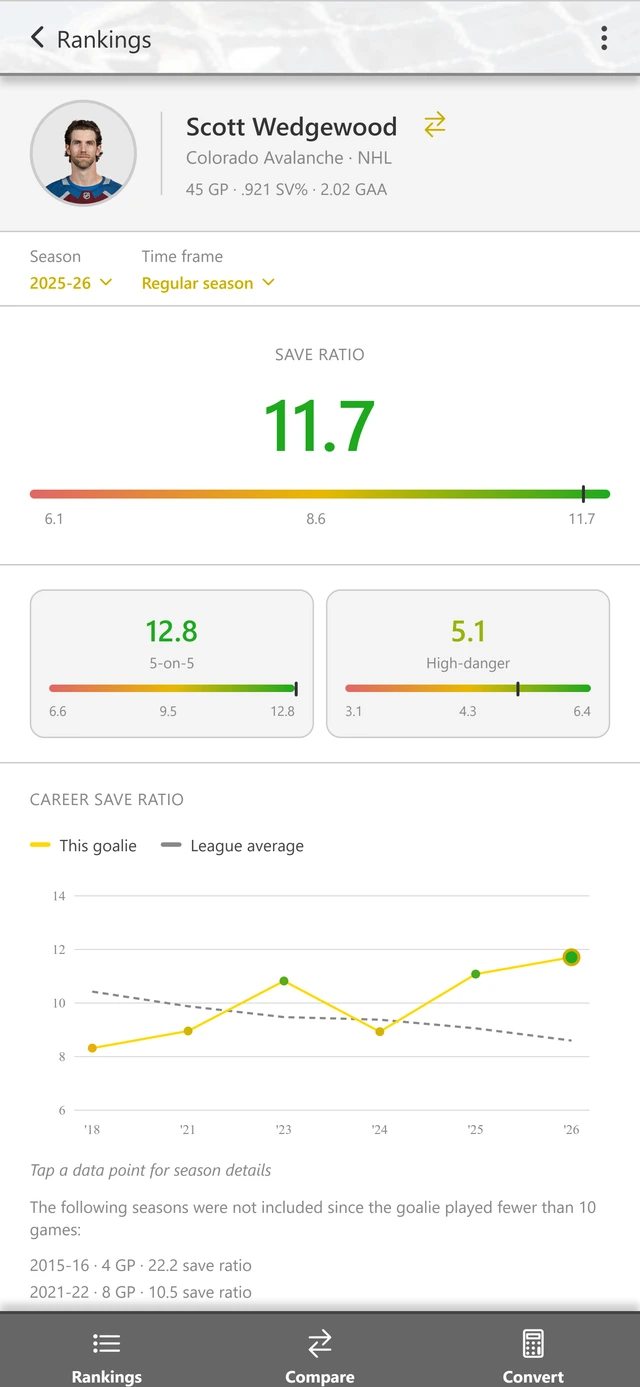
Go beyond the box score with 5-on-5 and high-danger splits powered by NHL EDGE, so you can review goalie performance in a standardized way, and under pressure.
Career history
Every goalie has a detail page showing their save ratio stats, a customizable time frame, a career graph, and recent games.
Goalie comparison
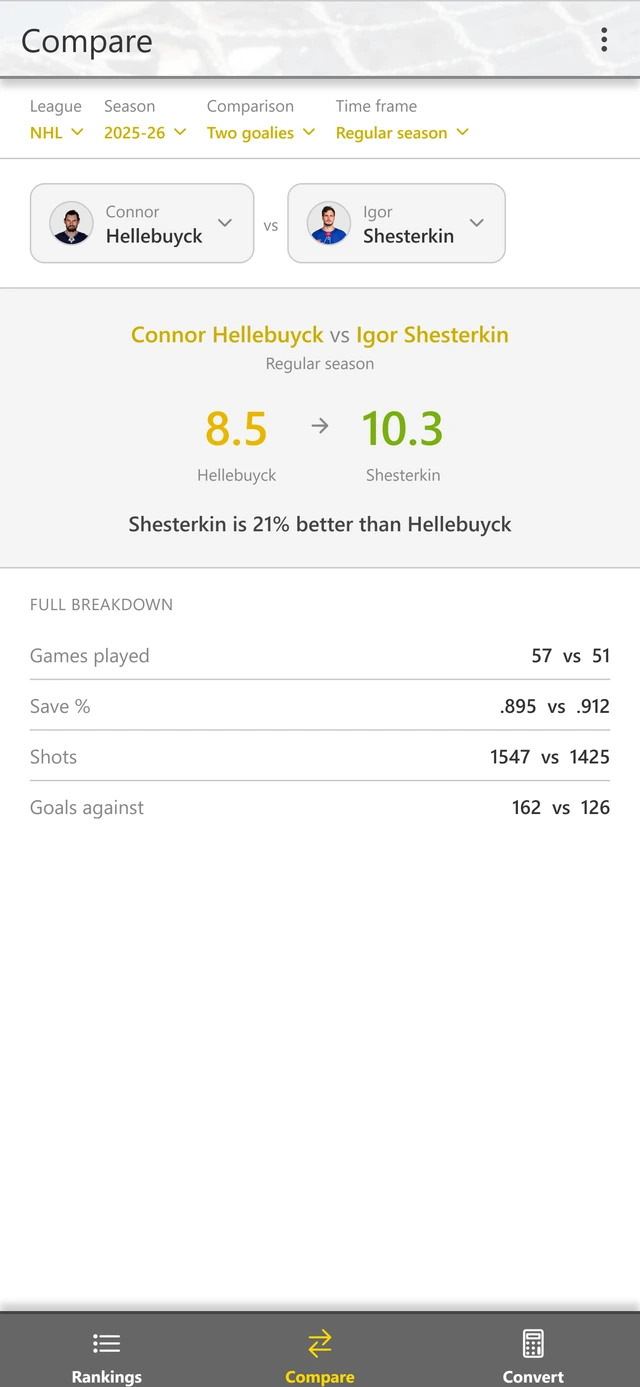
Compare two goalies across various time frames, or compare a single goalie against their own historical performance.
Shareable cards
Turn a goalie, a career or a head-to-head into a clean image. Save it to your photos, or send it straight to a group chat.
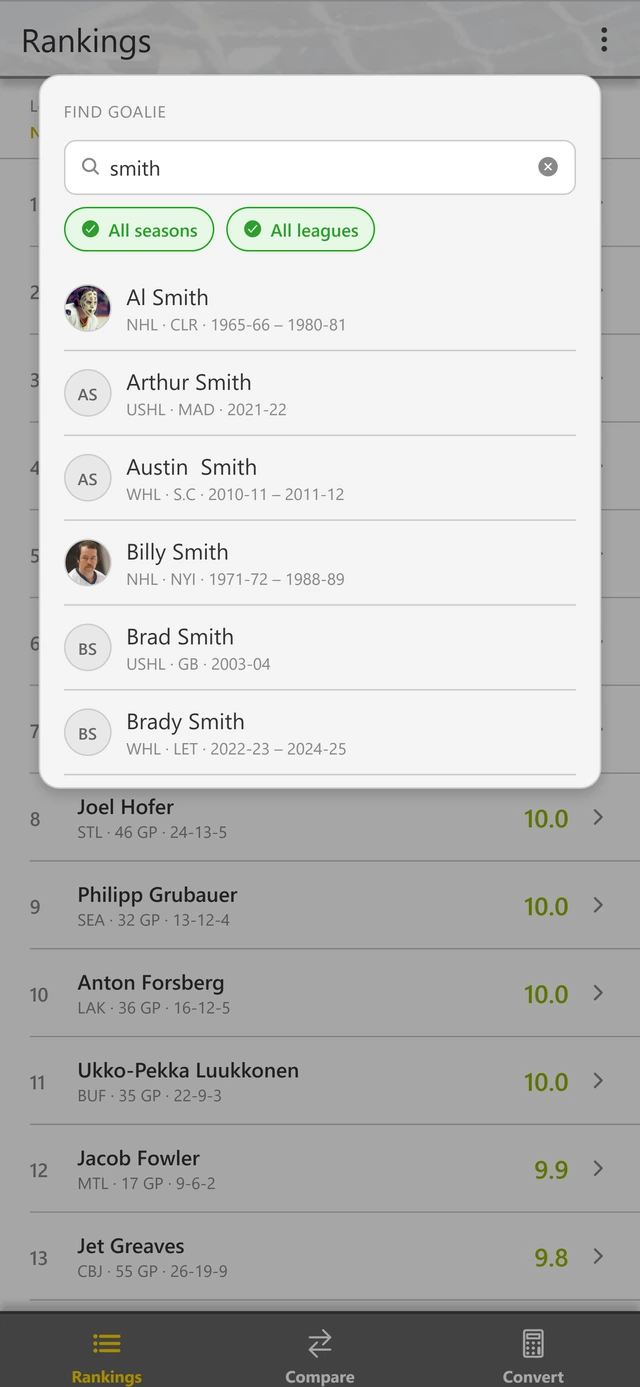
Find goalie
Search by name across every league and season we cover, and jump straight to that goalie's page.
Stats converter
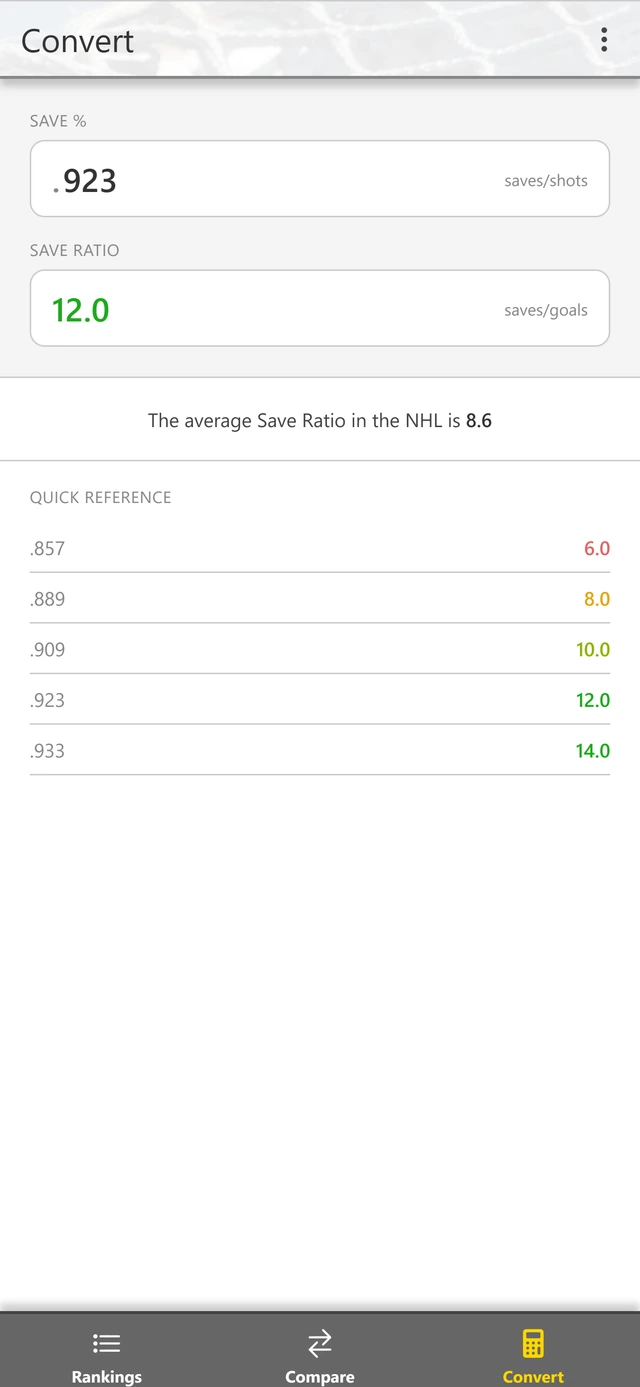
Easily translate save percentage to save ratio, and vice-versa, for any goalies who are not in the system.
Private by design
No account and no personal data collected by us. Ads are served by Google AdMob, which uses an advertising ID. Your preferences stay on your device. Read our privacy policy.
The metric
The gap is bigger
than you think
In 2025-26, NHL goalies who played at least 20 games had a save percentage that ranged from .921 (Scott Wedgewood) to .860 (Leevi Meriläinen). A world of difference is crammed into this tiny spread of only .061 points.
Using save ratio, the same stats show that Wedgewood made 11.7 saves for every goal allowed, while Meriläinen made only 6.1 saves for every goal allowed. This massive 91% difference shows that Wedgewood was making saves at almost twice the rate of Meriläinen!
NHL 2025-26
spread Save ratio
difference
Coverage
Eight leagues, one app
Decades of data, from junior to the pros
In the app
Take a look
A fast, focused interface that gets out of the way of the numbers.
Share it
Create and share stats
Turn save ratio data into clean images with a single tap. Save images to your photos, post them to social media, or send them straight to a group chat.
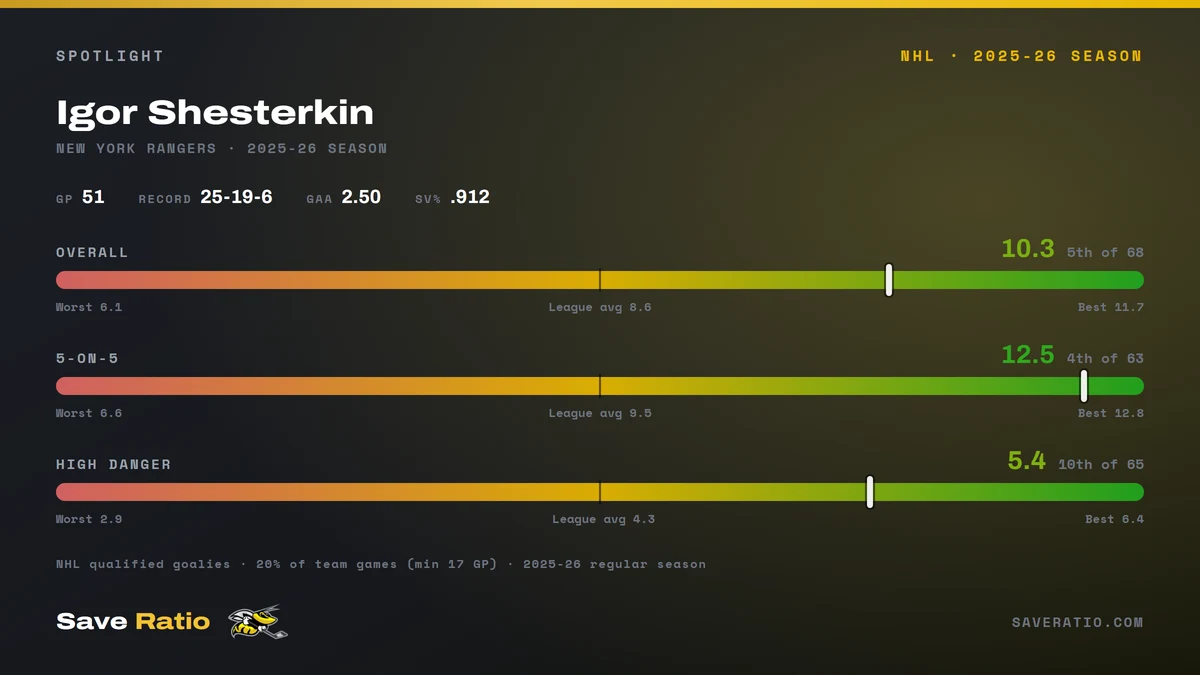
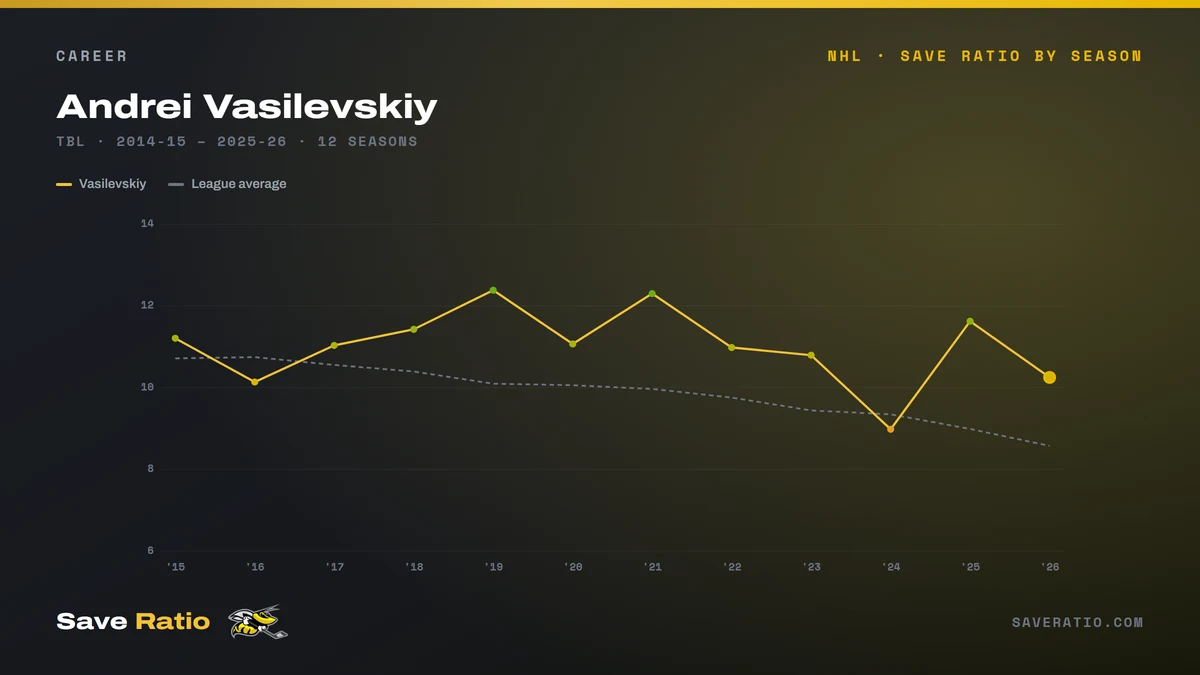
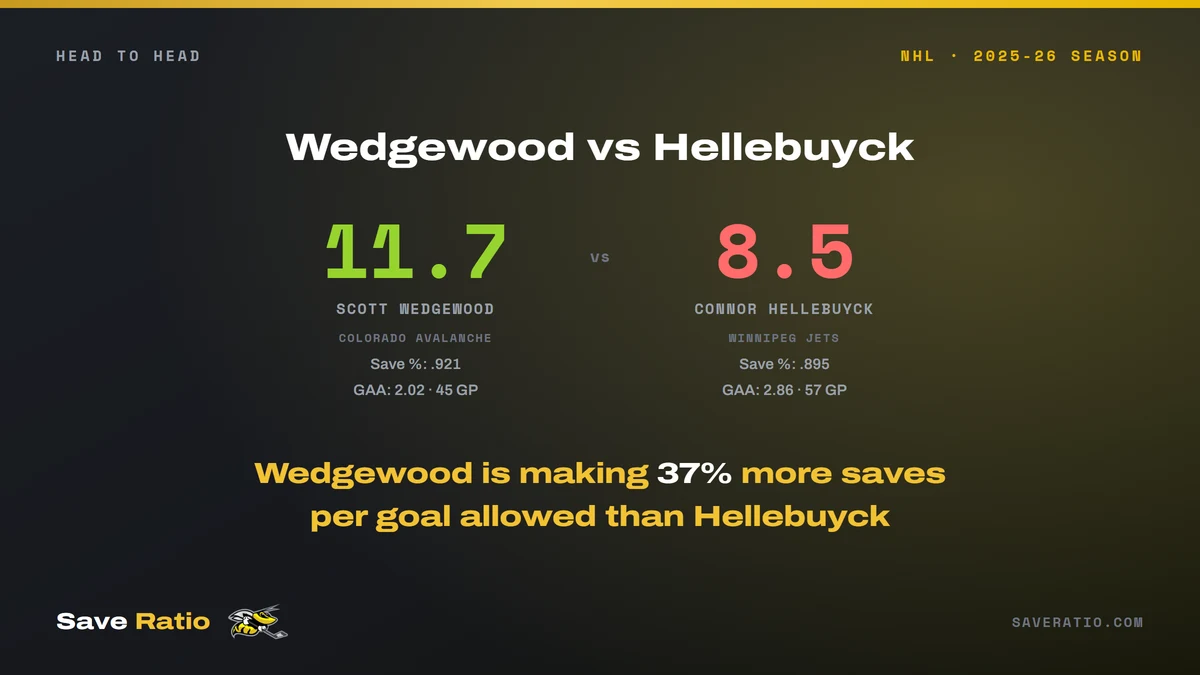
Actual cards produced by the app. Multiple types of cards are available, depending on which screen you share from.
Get Save Ratio
Free on iOS
and Android
This goalie stat will change how you watch hockey.
Works on phones and tablets.
Scan to install on your phone
Already using Save Ratio? Rate it on the App Store ★
Contact: [email protected]